impress-logo
space

Issue #2 - published by the IMPReSS project - February, 2015

space
space space
space

Successful First Year Review

space
space

The IMPReSS project had its first review in February 2015 in Brussels. At the review meeting, the project demonstrated several components of the first IMPReSS SDP prototype and the Teatro Amazonas user application. The results achieved in the different work packages were also presented by the work package leaders. During this first 15 months of the project, a total of 23 deliverables has been produced and they were all accepted by the reviewers. The accepted public deliverables will be made available for download shortly. Keep yourself informed via the IMPReSS website.

The development work on the second and final prototype and the UFPE pilot application is already underway and will take under consideration the discussions and feedback from the review meeting. This second period will focus on more complex elements of the use cases for the pilot sites. Particularly, the aspect of mixed-criticality will be emphasised, developed and tested.

to the top to top
space
space space
 

The Teatro Amazonas Pilot Application

 
space
The initial prototype for the Teatro Amazonas pilot application has been completed and was demonstrated at the review meeting.

Currently, it allows the user to extract information on the energy consumption in different rooms/areas of the theatre building for a specified period of time. It is also possible to see the energy consumption for different appliances across the entire building, for example, the energy consumption for all the air conditioning systems or all the lights.

While these functions may appear quite simple, they will nevertheless be a huge improvement to the current state of affairs as there is no energy monitoring or management system in place today. In other words, the management of Teatro Amazonas has no context information on the energy used in the building. The application developed using the IMPReSS SDP will allow the theatre to see for the first time how much energy different rooms, areas and electrical equipment consume. This type of information is a prerequisite for implementing ways to reduce the energy consumption.

to the top to top
space
space space
 

The Teatro Amazonas Public Display

 
space
The IMPReSS project believes that increasing the public awareness of energy consumption and the possibilities of saving energy should also be included in an innovative Smart Energy Management system.

The project has therefore developed a unique interactive public display system designed to inform the public of the current and historical energy consumption in the building; the public can choose to view the energy consumption for specific areas inside or outside the building.

The figure above shows the front page of the Teatro Amazonas public display screen. The figure below shows the building drawing which gives an overview of the energy consumed in the different areas of the theater. Users simply use their hands to navigate on the public display. Visitors can also select an area on the building drawing to display data on the energy consumption for that particular area.

The next step in the development process is to enable the public display to show how much energy has been saved as a result of the implemented Smart Energy Management system. The energy savings will be illustrated by numbers and by graphs. This function is particular important as we believe that a visual illustration of the energy savings will have a particularly strong impact on the viewer’s awareness of energy usage and on ways to save energy. Teatro Amazonas is an excellent show case for this because of its many visitors from both Brazil and the rest of the world. In addition, its location in the Amazon region creates a unique context for raising public awareness not only of CO2 footprint but also of the importance of protecting the Amazon rain forest.

Developing the IMPReSS Public Display

Several IMPReSS components were used to develop the public display application as depicted in the figure below:

In the bottom layer - the resource adaptation layer - the Resource Adaptation Interface (RAI) provides a unified software interface communicating with plugwise and enocean devices. Above the RAI, IMPReSS components such as Context and Data Analytics modules are used to simplify the development of the application logic. The Context Manager provides rule templates that can be extended to define the policy for controlling lighting based on room occupancy, the amount of daylight coming from the window, and the schedule specifying when the rooms are to be used. The data analytics module provides algorithms used to determine the users’ occupancy pattern. This will allow regulation of the air conditioner to pre-coolthe rooms before the users enter.

to the top to top
space
space space
 

The IMPReSS Debugging Tool

 
space
One of the objectives in the project is to develop a high-level debugging tool which allows developers to trace events and interactions between distributed components.

Event Management is a crucial function in the IoT ecosystem in general, enabling both loosely coupled communications and data management. In highly distributed systems involving large numbers of devices and actors, the possibility of doing event traceability and debugging is important. For this reason the IMPReSS platform researches and designs mechanisms and tools that support the developers tracing and debugging event patterns and event history, using the LinkSmart event processing architecture. As the first cycle in the project has come to an end, an initial prototype of the IMPReSS Event Debugging Tool has been developed.

There are two basic parts of the Event Tracing and Debugging Tool:

1) The Event Manager Eavesdrop: Provides the functionality of listening to and processing all events passing through an Event Manager. This also contains a simple browser with query capabilities.

2) The Event Network Browser: Provides functionality to query which events have been created or consumed by individual event consumers/producers.

We will here present only the Event Network Browser. For information on the Event Manager Eavesdrop you may download the deliverable D7.4.1 Initial Design and Implementation of the IoT Event Debugging Tool.

The Event Network Browser part of the Event Trace and Debugging Tool provides functionality to look inside individual event producers and consumers to see which events they have created or consumed. This is very useful when debugging complex event problems where it is not clear who created the event and who consumed it. Typically this functionality can be used to pin point which component is not behaving as expected, i.e., not consuming or creating the correct events.

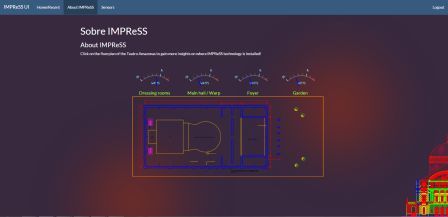
Applications for energy management systems are the primary interest for the theatre. Any management system will be an improvement over the present status.

The Event Network Browser part uses functionality in LinkSmart to find and connect to the different event consumers and producers that are part of the LinkSmart network, see the figure below.

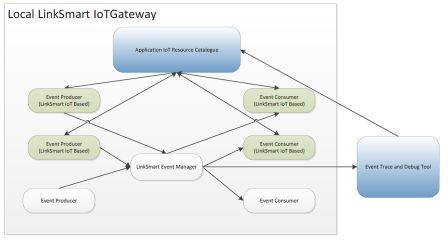
The basic principle used by the Event Network Browser is that it uses the Application IoT Resource Catalogue, which is part of LinkSmart, to find all the LinkSmart based event producers and consumers currently on the network. Using the information returned from the catalogue the Event Network Browser is able to contact the individual producers and consumers.

To allow the Event Network Browser to query the producers and consumers, a new service has been created within the LinkSmart IoTResource class library which exposes a Web Service and REST interface where queries on events created or consumed can be made, see below:

All LinkSmart IoT Resource based components will automatically get this added functionality without changes to the original IoT Resource. It only requires the developer to update the LinkSmart libraries used. Note also that this functionality not only provides the interface but also provides the actual storage of events created or consumed.

The Event Debugging and Tracing Tool provide a simple web based interface for browsing for IoT Resources and to look at events created or consumed by the resource.

The information shown in the tool contains the resource name, the resource type and a link to show the events processed by the resource. Clicking Show Events will display basically the same event browsing tool used by the Event Manager Eavesdrop, but with the exception that filters for received or sent events can be selected. The information displayed is retrieved directly from the IoT Resource itself using the Event Query Interface.

to the top to top
space
space

space
space
header bg

You're receiving this newsletter because you have been in contact with one or more of the IMPReSS partners.

We thought you might be interested in following the progress of the project.

Copyright The IMPReSS Consortium © 2014 - Please feel free to quote the content in this newsletter.

Please see our Legal Notice for disclaimers and rights.

Having trouble reading this? View it in your browser. Not interested? Unsubscribe instantly.